

When receiving complaints from a client, such as “everything is slow”, “users are complaining”, “the process is too slow”, etc., «DB Serv» performs a large number of checks to diagnose the problem.
In this article, we will describe how we help solve infrastructure problems on the DBMS server. It is common to refer to everything related to hardware: CPU, RAM, disc subsystem, and network.
Physical overloading of the server can lead to a database connection error (Error establishing a database connection), so in order not to compromise the continuity of your business, it is necessary to constantly monitor how many resources your hardware has at its disposal.
Monitoring tools
The basic monitoring tools include the DBMS activity monitor, as well as the standard Windows tools that allow you to get information in a more detailed version: Task Manager and Resource Monitor. Let’s take a closer look at each of them.
1. DBMS Activity Monitor
This tool helps to monitor several important indicators, such as CPU and disc consumption, as well as the number of running packages and waiting processes.
Note that the activity monitor creates a tangible load on the DBMS and should be closed as soon as the diagnostics are completed.
In the “Processes” tab, you can easily find the root of the blocking if all scripts have suddenly disappeared.
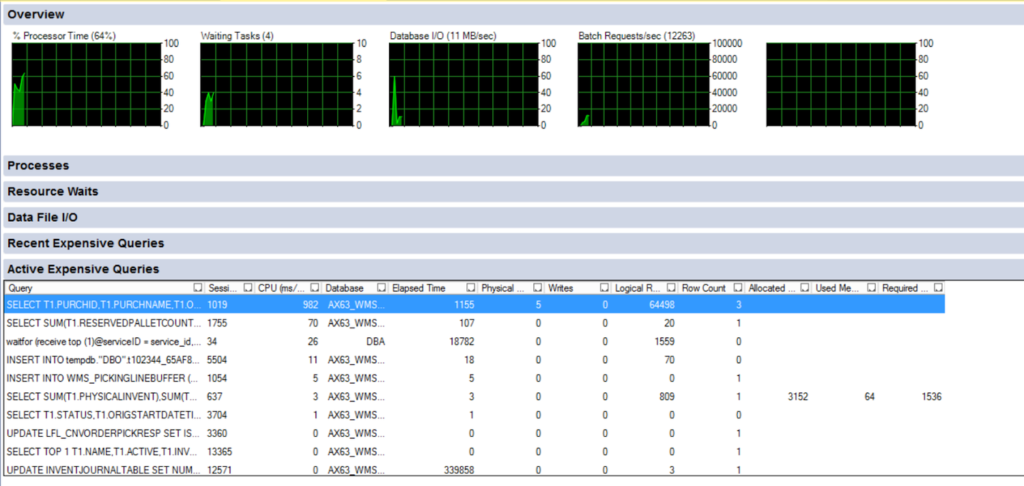
What most often slows down processes:
● Buffer I/O – queue to I/O buffer, if the values are large (for example, above 80), there are probably several requests with wrong plans being executed.
● Logging – queue for writing to the database transaction log, if there is this queue, it means that there are a lot of operations of changing or adding data in the database (or there are some problems with the disc for transaction logs).
● Lock – the number of active locks.
2. Task Manager
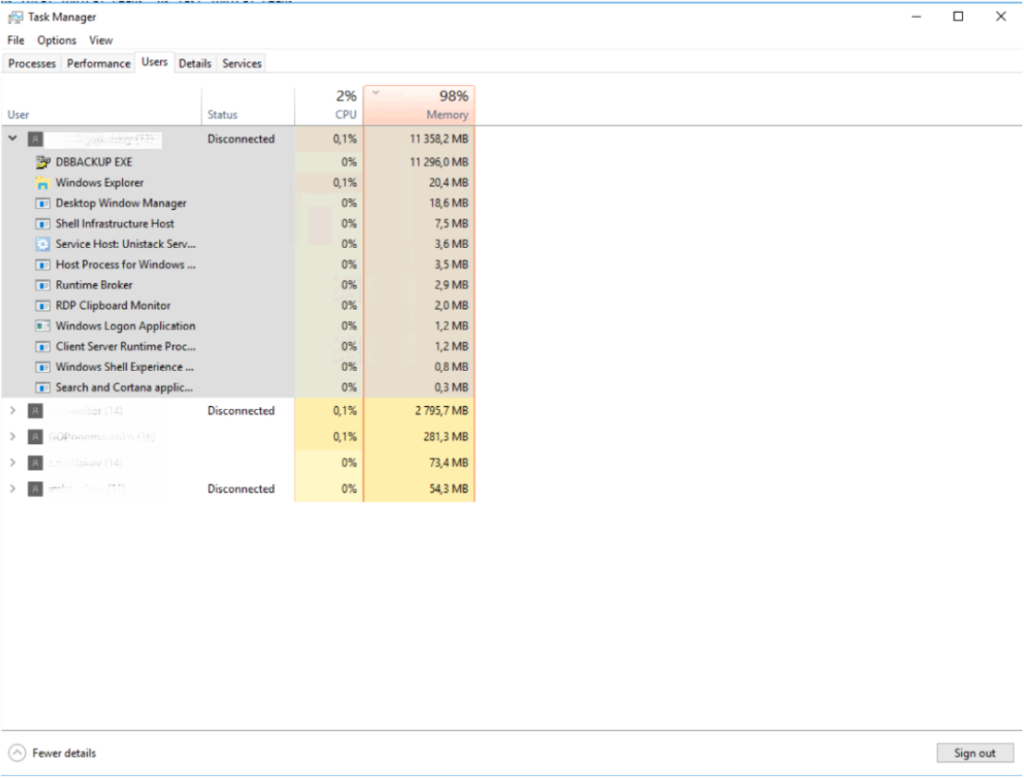
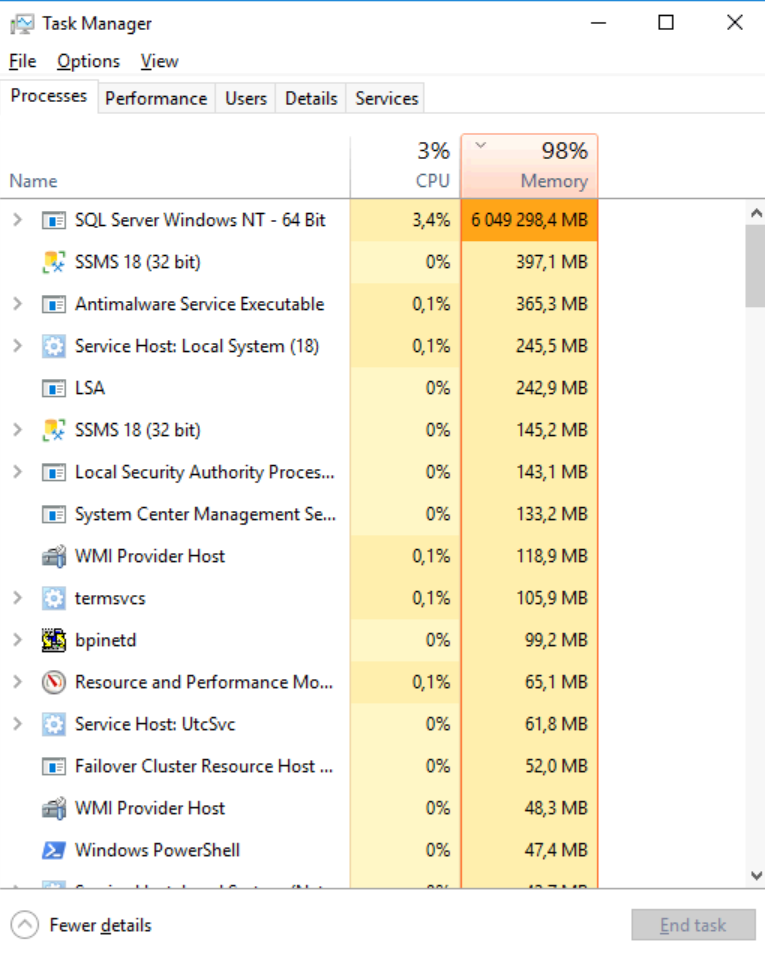
Task Manager is a well-known Windows tool that efficiently aggregates information such as read/write to discs. Also in the Manager, you can see how much resources are consumed by certain users and find out details about the software they are using.
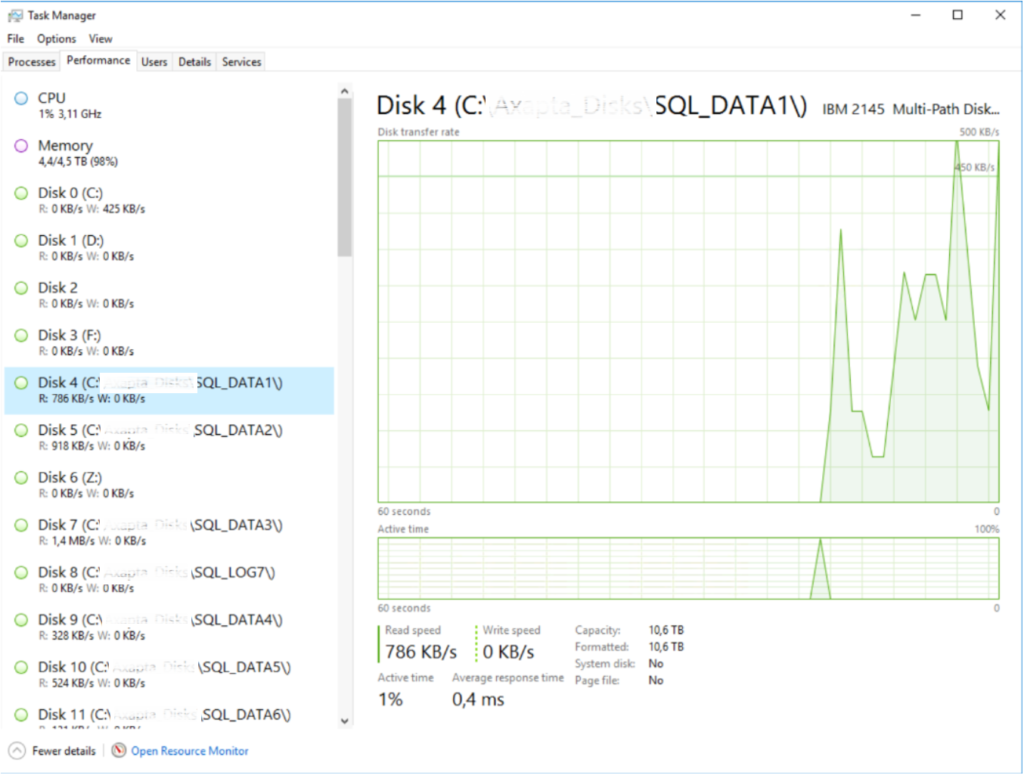
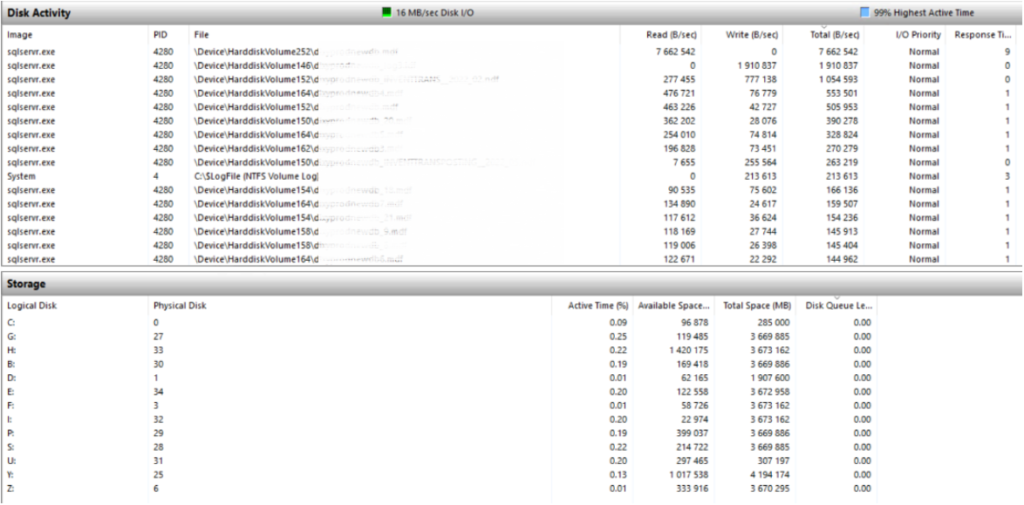
The Resource Monitor can be opened through the same Task Manager. In it, you can see more information about the load of cores or disc queues. Most of all, you should pay attention to the breakdown by cores of the total CPU load, as well as response time (no more than 10 ms is considered normal) and disc queues (no more than 20 is normal).
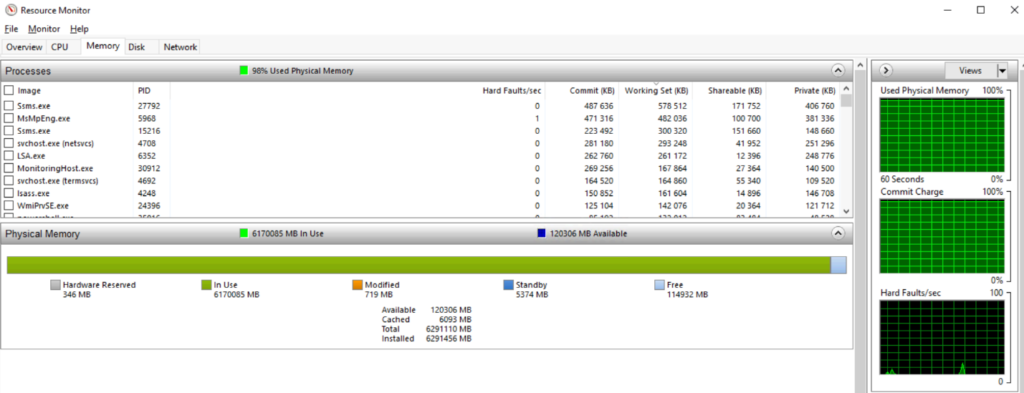
You can also take a detailed look at the memory usage structure in the Resource Monitor, although the DBMS memory usage is not always correctly displayed in figures.
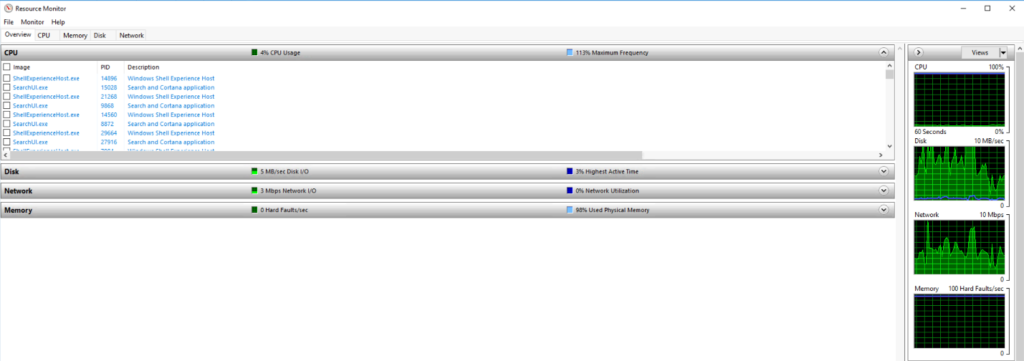
If the response time is more than 100 ms. and the queue length is more than 100, this indicates a problem. We may assume that the issue is the lack of processor capacities, however, if the CPU usage graph does not exceed 100%, we should check in the Task Manager how each of the cores is loaded. If some of them are idle, it is most likely that they are simply not used by the DBMS (for example, due to the license limitation).
Disc queues
The disc queue metric is considered to be one of the main parameters of the disc subsystem workload, but to adequately assess it, it is necessary to accurately represent the physical structure of the storage system.
If we consider a disc physically as a single device, then more than two requests in a queue will signal that the disc is overloaded and cannot process incoming requests.
However, we are almost always dealing with storage systems that include dozens of discs in various RAID configurations and some amount of fast SSD cache.
For example, for a single hard drive, a value greater than 2 is considered critical, and if the drive is on a RAID array of 4 discs, a value greater than 4*2=8 is critical.
Disc queues of more than 100 are normal for powerful storage systems on SSD discs in case of their active use, but at such times discs with queues will produce speeds of thousands of Mbytes per second.
Indirect indicators of infrastructure problems
These are usually messages in the OS and DBMS logs, which can be quickly viewed with the xp_ReadErrorLog procedure from the administrator panel, and which indicate the presence of problems.
There are two main ways to view the details of the crash.
Option 1: Connect to the instance where the crash occurred and view the Extended Event.
If this Extended Event is not displayed (if there is information about the crash in Zabbix and server logs), it means that it did not fit in the Extended Event log.
To fix this, you need to right-click on “error8623” in SSMS, go to properties ⇒ advanced, and increase max memory size. By default it is set to 4MB (on some servers 8MB), and not all events can be recorded. To make the changes you need to stop the policy and then remember to start it again.
Option 2. View the file whose location is searched for with the following query:
SELECT LEFT(CAST(serverproperty(‘ErrorLogFileName’) AS VARCHAR(255)),len(CAST(serverproperty(‘ErrorLogFileName’) AS VARCHAR(255)))-8)
Depending on the version, the directories may vary, but typically these are options such as:
● C:\Program Files\Microsoft SQL Server\MSSQL13.MSSQLSERVER\MSSQL\Log\error8623….xel
● C:\Program Files\Microsoft SQL Server\MSSQL12.MSSQLSERVER\MSSQL\Log\error8623_0_131939863147480000.xel
When such messages appear, «DB Serv» notifies its clients promptly, indicating the time and the request, which are displayed in the log.
Examples of common problem reports
1. SQL Server detected a logical consistency-based I/O error: stale page (a page read returned a log sequence number (LSN) (0:0:1) that is older than the last one that was written (0:0:0)). It occurred during a read of page (1:13554240) in database ID 2 at offset 0x000019da480000 in file ‘D:\SQLDATA\tempdb.mdf’
Messages of this type indicate a problem with the discs. It can be either bit sectors, which can be fixed by the OS checking the disc, or logical problems inside the database, which can be fixed by integrity checking.
2. Process 0:0:0 (0x83b0) Worker 0x0000017515F58160 appears to be non-yielding on Scheduler 9. Thread creation time: 13295012433755. Approx Thread CPU Used: kernel 15 ms, user 70531 ms. Process Utilization 59%. System Idle 35%. Interval: 70579 ms.
This message indicates a shortage of CPU resources at a particular point in time. Probably the peak load on the CPU (up to 100%) occurred at this moment. If there are many such messages in the log, it is a clear indication of CPU overloading.
3. SQL Server has encountered 11 occurrence(s) of I/O requests taking longer than 15 seconds to complete on file [D:\SQLDATA\templog.ldf] in database id 2. The OS file handle is 0x0000000000001060. The offset of the latest long I/O is: 0x0000001b0ca200
This message indicates that the disc subsystem is not coping with the load. It is associated with large disc queues and delays.
4. A time-out occurred while waiting for buffer latch — type 4, bp 0000008CCC0BAC80, page 3:13183440, stat 0x1010f, database id: 9, allocation unit Id: 6488064, task 0x0000008BEA3AFC28 : 0, waittime 300 seconds, flags 0x1000000019, owning task 0x0000008BF9057C28. Not continuing to wait.
This message may indirectly indicate a shortage of RAM or an increased load on RAM.
5. Stack Signature for the dump is 0x0000000164276703
In addition to this message, similar messages with the word «dump» may also appear. They usually mean that a DBMS dump has occurred (sometimes with a service crash). They may also indicate infrastructure problems – but only a professional can clarify this.
Normal DBMS server performance
In conclusion, let us list the normal DBMS server indicators, which DB-Service uses in its work:
➡️ Free RAM for most servers should be at least 5% or at least 2 GB. This is necessary to keep the server from going into BsoD.
➡️ CPU utilization in a burrow should not exceed 90%. Rare peaks of up to 100% are acceptable, but if the server starts running in this mode for a long time, it indicates problems.
➡️ Disk queues are no more than 10, and preferably equal to 0.
➡️ Latencies on discs not more than 20 ms.
Note that at high read/write speeds (more than 300 Mbyte/s., and especially more than 1 Gbyte/s.) high queues and long response times are considered conditionally normal – these are peculiarities of some storage systems.
Resume
We reviewed the basic tools for performance monitoring and diagnosing infrastructure problems on a DBMS server. We touched upon the topics of indirect indicators of faults, the main types of errors, and normal server performance indicators.
Contacting our engineers who specialize in DBMS server administration is key to protecting your databases from any database server connection errors caused by iron overload.