Locks in MS SQL
During transaction execution, MS SQL places temporary restrictions, known as locks, on certain database operations. This fundamental mechanism ensures data integrity. While locks are crucial to the functioning of MS SQL, there are situations where processes intersect suboptimally, making concurrent data access impossible. In this article, we explain how DBServ diagnoses such issues..
General Approach to Lock Monitoring
In our MS SQL lock monitoring, we classify locks into the following categories:
- Blocked processes with a duration of over 30 minutes detected: Indicates one or more locks lasting longer than 30 minutes in the database.
- Blocked processes with a duration of over 1 hour detected: Indicates one or more locks lasting longer than 60 minutes, an escalation of the previous monitor.
- Old lock detected: Identifies a long-standing lock of several hours, marking the highest alert escalation based on lock duration.
- Locking issue detected: Indicates that more than a specified number of locks have occurred within a set time frame, often alongside other alerts, signaling a worsening lock situation.
- Number of Deadlocks per second: Shows a significant rate of deadlocks, with more than a specified number per second, indicating system issues.
- HADR process is blocked: A log application process is blocked on a secondary database replica, potentially leading to log lag and filling on the primary replica.
Primary Methods of Lock Diagnosis
At DBServ, lock analysis focuses on identifying the root cause of the issue and providing clients with comprehensive information, including details on application sessions (often in Microsoft Dynamics AX). For analysis, we use stored procedures and custom scripts, as outlined below.
1. Diagnosing with Scripts
To gain an overview of activity, including lock details and resources in wait, we use a stored procedure to list active sessions. An example of the output from this procedure is shown in the screenshot below.

The second procedure we use for diagnostics creates a “lock tree,” which makes it easy to identify the root cause of the problem and list the locks under it. An example output from this procedure is shown in the screenshot below.

As seen in the screenshot, the output provides all the necessary information: session ID, account from which it was launched, awaited resources, database information, resources in use, application name, query text, and more.
In case of an incident involving a prolonged lock, it’s best to run both scripts simultaneously in the same session. This allows us to see who holds the longest lock and the processes collected under it in a tree-like structure. An example of this is shown in the screenshot below.

Once the root cause is identified, we provide the client with comprehensive information on the issue, after which we await a decision on whether to terminate the responsible session or wait for it to complete.
2.Diagnosing with MS SQL Standard Procedure or Activity Monitor
In critical situations, when all access to the production database — and often even to system views — is blocked (sometimes due to a high volume of locks), the standard sp_lock procedure is used for diagnosis. Unfortunately, under these conditions, gathering detailed information on the session responsible for the most locks is usually not possible. The only option left is to terminate this session to restore database functionality.
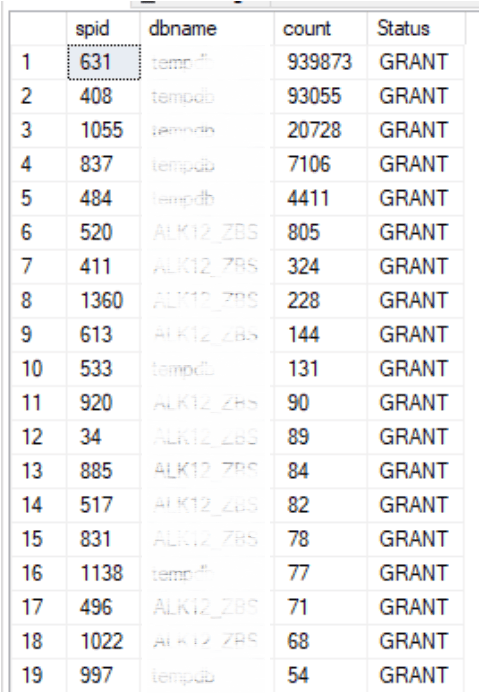
An example of the sp_lock procedure output using a temporary lock table in SQL is shown in the screenshot below.

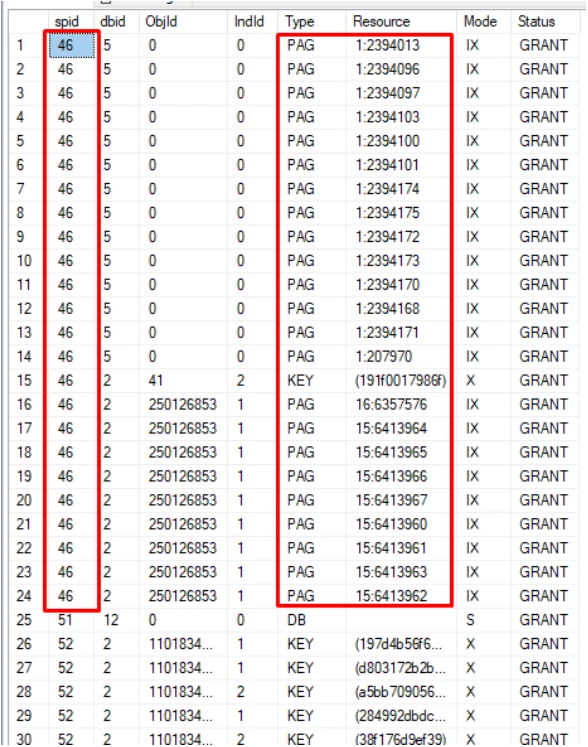
It is essential to understand that the number of locks displayed in the output does not represent the number of blocked sessions. Instead, it shows all the locks imposed by a session, which may include schemas, databases, individual pages, and key ranges. An example illustrating SQL locks is shown in the screenshot below.

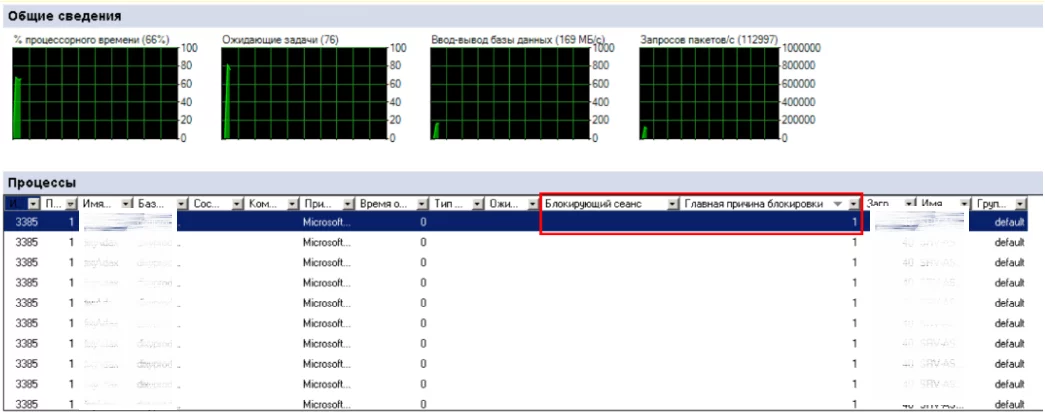
If the number of locks is manageable, another quick and effective option for viewing them is to use the Activity Monitor. An example of its usage can be seen in the screenshot below.

Primary Methods of Lock Diagnosis
The apply process (HADR process) on a secondary replica is also subject to locks, often due to a high number of read requests on the read-enabled secondary replica. In such cases, standard procedures may not always reveal the root cause, so we use a custom script.
Our experience, including work with a large online cosmetics and fragrance retailer, shows that the root cause is typically a session reading data for corporate reporting from the secondary replica with read-only routing enabled. This session places an S-lock on objects to read data. If exclusive locks (e.g., SCH-M, U, X) are applied to those objects on the primary replica—such as during index rebuilds or client-initiated object modifications — then the read operation on the secondary replica blocks the application of these changes.
In such cases, we identify the conflicting sessions either from the maintenance job history or through client processes by analyzing traces with sp_trace_events. This enables us to pinpoint which process on the primary replica is conflicting with the secondary.
Presenting Information on Blocking Sessions to the Client
Once the root cause of a lock is identified, we usually provide the information to the client in text format. However, if there is extensive data on locks, the report is sent as an Excel table. For Microsoft Dynamics AX (Axapta), we supplement standard information (host, login, query, etc.) with details on the internal application session, as this context is essential for the client to understand the data.
Special Cases
Occasionally, while reviewing session details, the ProgramName field may display a message indicating the operation of MS SQL jobs, such as “SQLAgent – TSQL JobStep (Job ”0x989F53FA6415FA45AB8954A2612BF64D” : Step 2).” At DBServ, we use scripts that allow us to view detailed information about these jobs or list all sessions in which these jobs are running. An example output is shown in the screenshot below.

Before delivering information on the blocking session to the client, we confirm who is responsible for initiating it and analyze SQL lock levels. Occasionally, the cause is not the top session but one of the blocked ones.
For instance, a session may be reading from a table, placing an S-lock, while another session (such as an index rebuild) is waiting for a U-lock on the table or index, unable to obtain it due to incompatibility. This situation can block additional sessions that are merely reading data. In such cases, terminating the second session is enough to resolve the lock chain.
Post-Incident Analysis of Locks and Deadlocks
Often, after a major incident resulting in a halt to client processes, a task is created to analyze the lock list. This is typically done through trace analysis or extended events, which are preconfigured for all clients. As part of our MS SQL Server administration and support, DBServ offers log and trace file analysis services. Our engineers are skilled in troubleshooting performance issues related to blocking, unplanned changes in execution plans, and errors within the SQL Server DBMS.
Conclusion
This article reviewed the primary types of incidents caused by MS SQL blocking, detailing how DBServ diagnoses these issues with procedures and scripts, the standard MS SQL sp_lock procedure, and Activity Monitor. We also discussed secondary replica blocking in AlwaysOn, the format of blocking reports provided to clients, and the post-incident analysis of Microsoft SQL Server blocking and deadlock conflicts.
To start a collaboration, please leave your contact details through the application form, and our specialists will get in touch with you as soon as possible.

